Explore CrocWatch crocodile sightings, Queensland, 2010 to 2015
Charts and tables over the 1,933 rows of the latest version, worked out in your browser from the Parquet file. Nothing you do here leaves the browser until you save a link.
Paste this where the dashboard should appear. The frame shows the attribution and links back here.
The explorer needs JavaScript and a browser from the last few years. The dataset page has every file and the query API.
Press Edit on any panel to change its chart type and drag fields into Group by, Split by and Filter. Drag a panel by its title to move or dock it, and click a bar in the first chart to filter the rest.
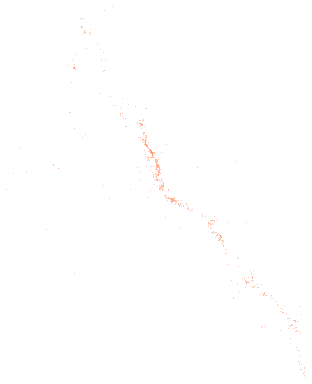
Data: Department of the Environment, Tourism, Science and Innovation, Queensland Government, Crocodiles in Queensland, sourced 3 October 2026, https://www.data.qld.gov.au/dataset/crocodile-sightings-in-queensland, licensed under CC BY 4.0. Licence terms.
How it works
Change a panel
Press Edit at the top right of a panel to open its settings. Drag fields into Group by, Split by, Sort by and Filter, pick a chart type at the top, and choose sum, count or average beside each number. More fields lists everything else in the dataset. The chart types include bars, lines, areas, scatter plots, heatmaps, treemaps and sunbursts, and maps of the coordinates. Add a chart puts a new panel on the dashboard. Drag a panel's title bar to move it, or drag the line between panels to resize.
Filter every panel at once
The chart marked Click to filter the others does just that: click a bar and the other panels show only those rows. Click it again to clear. Any panel can do the same. Open the menu at the left of its title bar and turn on filtering from there.
Share or keep a dashboard
The address bar holds the whole dashboard, so copying it is enough. Save a short link to store the dashboard on this site and get a shorter address. A saved dashboard never changes; saving again after an edit makes a new link. Embed gives a frame you can paste into a web page, with the attribution inside it.
Download what you see
The export button in a panel's settings toolbar downloads the panel as CSV, JSON or Arrow, or a chart as PNG. The copy button beside it puts the same data on the clipboard. The full files are on the dataset page.
What the fields mean
The explorer names each field in words. The files and the query API use the field name beside it.
| In the explorer | Field name | Type | Note |
|---|---|---|---|
| Year | year | integer | |
| Reference number | crocodile_reference_number | string | The department's reference for the report. A few numbers appear twice. |
| Date sighted | date_sighted | string | Day/month/year as written, or No data. Kept as text because the column mixes dates and words. |
| Crocodile of concern | crocodile_of_concern | string | |
| Resolved crocodile of concern | resolved_crocodile_of_concern | string | |
| Confirmed by a departmental officer | confirmed_by_officer | string | |
| Zones 1 or 2 | zones_1_or_2 | string | |
| Crocodile management plan | crocodile_management_plan | string | |
| Local government authority | local_government_authority | string | |
| Management plan zone | management_plan_zone | string | |
| South of the Boyne River | south_of_boyne_river | string | |
| Attack or aggressive | attack_or_aggressive | string | |
| Location or behaviour a threat | location_or_behaviour_a_threat | string | |
| Prevention barrier and stock | prevention_barrier_and_stock | string | |
| Urban management area | urban_management_area | string | |
| Crocodile of concern assessment | coc_assessment | string | |
| Outcome | outcome | string | |
| Date removed | date_removed | string | |
| Imminent threat to safety | imminent_threat_to_safety | string | |
| Date the department was contacted | date_of_contact | string | |
| Species | species | string | |
| Number of crocodiles | number_of_crocodiles | string | |
| Size of largest (m) | size_of_largest_m | string | The reporter's estimate in metres. Kept as text because some reports give a range or words. |
| Tracks left | tracks_left | string | |
| Nest or slide present | nest_or_slide_present | string | |
| Location | location | string | |
| Latitude | latitude | number | |
| Longitude | longitude | number | |
| River, creek, beach or waterhole | waterway_or_beach | string | |
| Habitat | habitat | string | |
| Nearest public area | nearest_public_area | string | |
| Public use type | public_use_type | string | |
| Intensity of use | intensity_of_use | string | |
| Intensity of use comments | intensity_of_use_comments | string | |
| All parts exposed | all_parts_exposed | string | |
| Eye exposed | eye_exposed | string | |
| Head exposed | head_exposed | string | |
| Tail exposed | tail_exposed | string | |
| Head and back exposed | head_and_back_exposed | string | |
| Gait high | gait_high | string | |
| Gait sliding | gait_sliding | string | |
| Gait running | gait_running | string | |
| Gait walking | gait_walking | string | |
| Gait swimming | gait_swimming | string | |
| Moving quickly or slowly | moving_quickly_or_slowly | string | |
| Direction of travel | direction_of_travel | string | |
| Two metres or greater | two_metres_or_greater | string | |
| In known habitat | in_known_habitat | string | |
| Moving through | moving_through | string | |
| Food source fish frame | food_source_fish_frame | string | |
| Food source abattoir | food_source_abattoir | string | |
| Food source crab pots | food_source_crab_pots | string | |
| Food source smelly bins | food_source_smelly_bins | string | |
| Food source boat ramp | food_source_boat_ramp | string | |
| Food source dugong | food_source_dugong | string | |
| Food source turtle | food_source_turtle | string | |
| Food source animal carcass | food_source_animal_carcass | string |
How it runs
The page downloads DuckDB and Perspective once, about 17 MB, then this version's data.parquet (416 KB). Every chart is a query DuckDB answers in the browser, so there is no rate limit and the files stay the only source. Dated versions never change, so a saved dashboard over one shows the same numbers for good. A map panel draws its background from OpenStreetMap tiles, so while one is on screen your browser asks OpenStreetMap for them and it sees your IP address. The data itself never leaves the browser.