Explore NSW government schools, locations and enrolments
Charts and tables over the 2,210 rows of the latest version, worked out in your browser from the Parquet file. Nothing you do here leaves the browser until you save a link.
Paste this where the dashboard should appear. The frame shows the attribution and links back here.
The explorer needs JavaScript and a browser from the last few years. The dataset page has every file and the query API.
Press Edit on any panel to change its chart type and drag fields into Group by, Split by and Filter. Drag a panel by its title to move or dock it, and click a bar in the first chart to filter the rest.
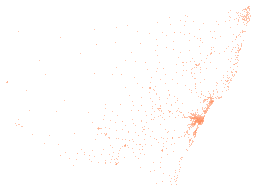
Data: NSW Department of Education, NSW Government, Master dataset: NSW government school locations and student enrolment numbers, sourced 3 October 2026, https://data.nsw.gov.au/data/dataset/nsw-education-nsw-public-schools-master-dataset, licensed under CC BY 4.0. Licence terms.
How it works
Change a panel
Press Edit at the top right of a panel to open its settings. Drag fields into Group by, Split by, Sort by and Filter, pick a chart type at the top, and choose sum, count or average beside each number. More fields lists everything else in the dataset. The chart types include bars, lines, areas, scatter plots, heatmaps, treemaps and sunbursts, and maps of the coordinates. Add a chart puts a new panel on the dashboard. Drag a panel's title bar to move it, or drag the line between panels to resize.
Filter every panel at once
The chart marked Click to filter the others does just that: click a bar and the other panels show only those rows. Click it again to clear. Any panel can do the same. Open the menu at the left of its title bar and turn on filtering from there.
Share or keep a dashboard
The address bar holds the whole dashboard, so copying it is enough. Save a short link to store the dashboard on this site and get a shorter address. A saved dashboard never changes; saving again after an edit makes a new link. Embed gives a frame you can paste into a web page, with the attribution inside it.
Download what you see
The export button in a panel's settings toolbar downloads the panel as CSV, JSON or Arrow, or a chart as PNG. The copy button beside it puts the same data on the clipboard. The full files are on the dataset page.
What the fields mean
The explorer names each field in words. The files and the query API use the field name beside it.
| In the explorer | Field name | Type | Note |
|---|---|---|---|
| School code | school_code | integer | |
| Commonwealth location ID (AGE ID) | ageid | integer | |
| School name | school_name | string | |
| Street | street | string | |
| Town suburb | town_suburb | string | |
| Postcode | postcode | string | |
| Phone | phone | string | |
| School email | school_email | string | |
| Website | website | string | |
| Fax | fax | string | |
| Enrolments (FTE, latest year) | latest_year_enrolment_fte | number | Full-time equivalent enrolments as reported to the ABS National Schools Statistics Collection, as at August. |
| Aboriginal and Torres Strait Islander students (%) | indigenous_pct | integer | Per cent of FTE students who identify as Aboriginal or Torres Strait Islander. The Department writes np where the student number is five or fewer; it is null here with a suppressed flag. |
| Language background other than English (%) | lbote_pct | integer | Per cent of students, by headcount, from a language background other than English, as at March. np where the student number is five or fewer. |
| Level of schooling | level_of_schooling | string | |
| Selective school | selective_school | string | |
| Opportunity class | opportunity_class | boolean | |
| School specialty type | school_specialty_type | string | |
| School subtype | school_subtype | string | |
| Preschool ind | preschool_ind | boolean | |
| Distance education | distance_education | string | |
| Intensive english centre | intensive_english_centre | boolean | |
| School gender | school_gender | string | |
| Late opening school | late_opening_school | boolean | |
| Date first teacher on duty | date_1st_teacher | date | The date the first teacher was on duty, which the Department treats as the date the school opened. |
| Council area | lga | string | |
| State electorate from 2023 | electorate_from_2023 | string | |
| State electorate 2015 to 2022 | electorate_2015_2022 | string | |
| Federal electorate from 2025 | fed_electorate_from_2025 | string | |
| Federal electorate 2016 to 2024 | fed_electorate_2016_2024 | string | |
| Operational directorate | operational_directorate | string | |
| Principal network | principal_network | string | |
| Operational directorate office | operational_directorate_office | string | |
| Operational directorate office phone | operational_directorate_office_phone | string | |
| Operational directorate office address | operational_directorate_office_address | string | |
| FACS district | facs_district | string | |
| Local health district | local_health_district | string | |
| AECG region | aecg_region | string | |
| Remoteness (ASGS 2016) | asgs_remoteness | string | |
| Latitude | latitude | number | As published. The Department's data dictionary does not state the datum. |
| Longitude | longitude | number | As published. The Department's data dictionary does not state the datum. |
| Assets unit | assets_unit | string | |
| SA4 | sa4 | string | |
| FOEI value | foei_value | number | Family Occupation and Education Index, the Department's school-level index of educational disadvantage. A higher value means more disadvantage. |
| Date extracted | date_extracted | date | The night the file was extracted. Fields come from different update cycles, so not every field was refreshed on this date. |
| Support classes | support_classes | string |
How it runs
The page downloads DuckDB and Perspective once, about 17 MB, then this version's data.parquet (241 KB). Every chart is a query DuckDB answers in the browser, so there is no rate limit and the files stay the only source. Dated versions never change, so a saved dashboard over one shows the same numbers for good. A map panel draws its background from OpenStreetMap tiles, so while one is on screen your browser asks OpenStreetMap for them and it sees your IP address. The data itself never leaves the browser.